
Let the accumulated data talk about the state of plasma
We have developed a method for grasping the state of plasma using a large amount of data accumulated in experiments in LHD and have succeeded in demonstrating its practicality. This result provides an example for methods to make the best use of the data accumulated in fusion research, and greatly advances research toward real-time control of plasma.
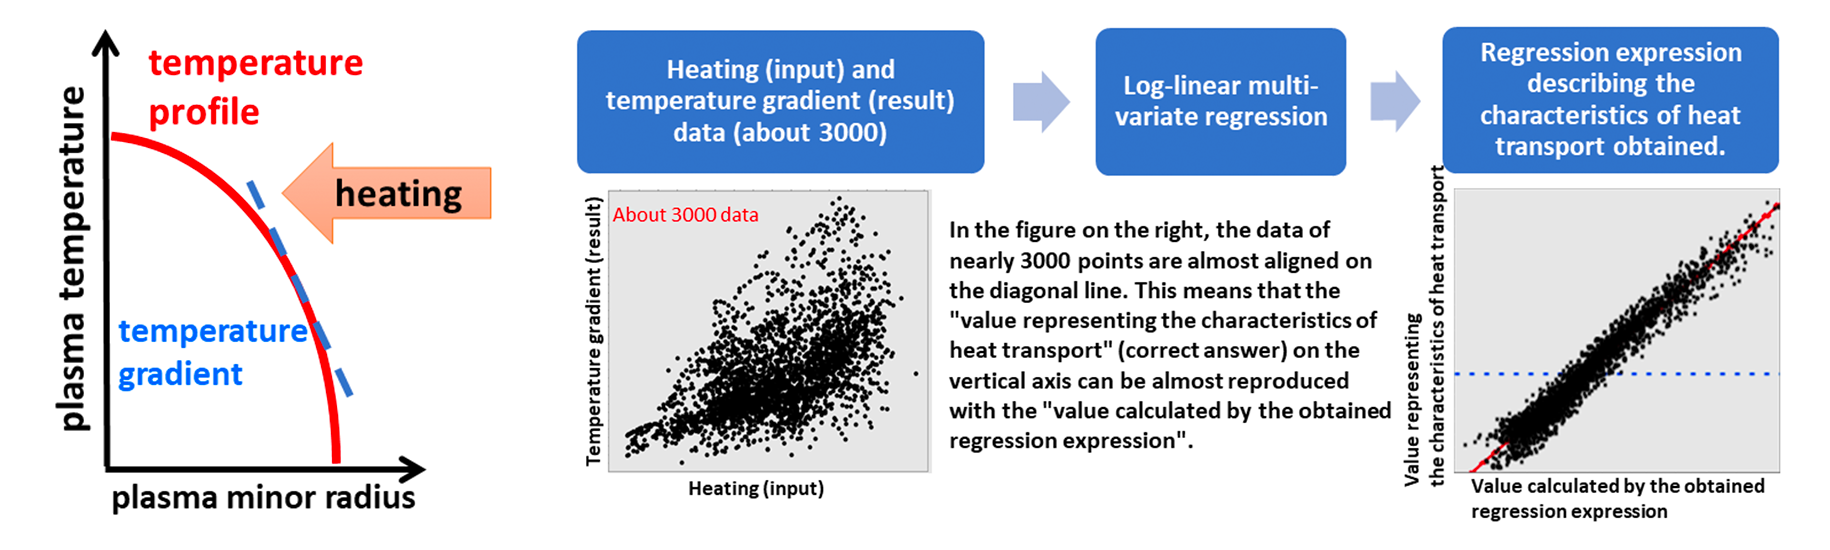
Right: Shows flow of data handling. When data (relationship between heating (input) and temperature gradient (result)) of nearly 3000 points, appear to be scattered as shown in left figure is analyzed by log-linear multi-variate regression analysis, desired "heat transport characteristics (vertical axis)”can be reproduced with single-line regression expression.
We have developed a method for grasping the state of plasma using a large amount of data accumulated in experiments in the Large Helical Device (LHD) and have succeeded in demonstrating its practicality. This result provides an example for methods to make the best use of the data accumulated in fusion research, and greatly advances research toward real-time control of plasma.
The temperature of fusion plasma rises when heated. The temperature is usually high in the center of the plasma and decreases towards the edge. Fusion power generation depletes energy by causing a fusion reaction in the central part, where the temperature is high. The state of the temperature difference for each position inside the plasma is expressed by the term "temperature profile", and the slope is called the "temperature gradient", as shown in Fig. 1.
So how much heat creates how much temperature gradient, and then what temperature is reached in the center? Knowing this is very useful for estimating the heating power required to bring the plasma to the temperature at which fusion will occur, and for thinking about how to control it when the temperature increases or decreases. This is a problem called "heat transport". It may seem like a very simple problem if we write it in words.
However, in the actual plasmas, the ions and electrons that make up the plasma collide with each other, vortices of various sizes are formed, the vortices merge into each other, or a flow in a certain direction is formed and the vortex is torn up. It is in a state of extreme complexity. By measuring vortices and flows in LHD experiments and simulating them with one of the world's leading supercomputers, we are proceeding with research to clarify how what is happening in plasma affects the formation of the temperature profile. However, it is such a difficult problem that is too complicated to be straightforwardly understood.
Therefore, this research team changed its way of thinking (a little). The heating power received by the plasma can be estimated by a fairly simple calculation. Since the temperature profile is measured experimentally, the temperature gradient can also be calculated. The idea is to understand the relationship between "input" and "result", with "how much heating is done" as "input" and "how much temperature gradient is created" as "result". The complex phenomenon occurring in plasma is set aside as a "black box" for the time being.
We have prepared nearly 3000 combinations of "input" and "result" from 31 LHD discharges. It was satisfactory to let AI "eat" this data group, but we wanted to try to understand the relationship between various physical quantities, so we used a method called "linear multi-variate regression". This is the method that appears at the beginning of the introductory book on statistics and is also used in the "Wine Equation" *.
* It is a mathematical expression based on a lot of past data on how some things such as temperature and rainfall affect the quality and price of wine. Using that formula, it is used happily in prophecies such as "This year's wine should be a wonderful vintage" even before the wine is made.
With this method, we derived an expression for the characteristics of heat transport. This formula is just one line each for ions and electrons, and if you know the values of some variables in the formula, you can immediately predict the temperature gradient as a result. Figure 2 shows the flow of this data handling.
This method reproduces the relationship between the "input" and "result" of the underlying data group within a certain accuracy (the spread of the data across the diagonal line in the figure on the right side of Fig. 2). You also have to check the accuracy when you try to apply for another target. We tried to reproduce the measured temperature profiles (2 discharges, 12 timings in total) for the plasma with the same heating method and density range as the data group was acquired. We were thrilled with the same task of seeing if this year's wine predictions actually eventuated. As a result, there were some cases where, as the result of the accumulation of slight differences in the temperature gradient predicted for each location of the plasma, the predicted value of the temperature at the center differed by more than 10 million degrees from the actual value. However, we were able to reproduce the “tendency” of temperature changes such as the rise and fall of the core temperature.
There is still a need to improve the method and expand the data, and due to the nature of this method, there is a limitation that it cannot be applied to plasma generated by a completely different heating method or density range. It is the same as the "wine equation" in one region not applying to wines of another region. However, we were able to show the method and its practicality of grasping the state of plasma, using a large amount of accumulated data. This result is not limited to LHD experiments but is also one of the methods of making the best use of the data accumulated in fusion research.
Fusion power plants are not expected to be fully equipped with various measuring instruments for research purposes. Also, the control perspective of operating the power generator is very important. It is necessary to grasp the states inside the plasma with limited available information and control the temperature etc. in real time. For that purpose, by maximally utilizing the world's most advanced diagnostics capabilities and the world's leading supercomputers, we have to advance the physical elucidation of what is happening inside the plasma and combine the viewpoint of "letting the accumulated data talk about the state of the plasma" with makeing great progress in research toward real-time control, etc.
LHD experiments have produced vast amounts of data. In addition to the research issues introduced here, there are many issues that can be tackled by "letting the accumulated data illustrate the state of plasma" approach. If you are confident in your data and statistical skills, why not conduct research with us?
This research was carried out in collaboration with Masayuki Yokoyama and Hiroyuki Yamaguchi of the National Institute for Fusion Science and based on fruitful discussions during one of author's (M.Y.)’s stay at the Institute of Statistical Mathematics (ISM), supported by 'The Researcher Exchange Promotion Program' of ROIS (Research Organization of Information and Systems).
This research result was published on September 14, 2020 in Nuclear Fusion, a journal on controlled thermonuclear fusion by the International Atomic Energy Agency.